Racing Analyze GUI
MATLAB · Multi-log telemetry analysis · Replay · Segment metrics
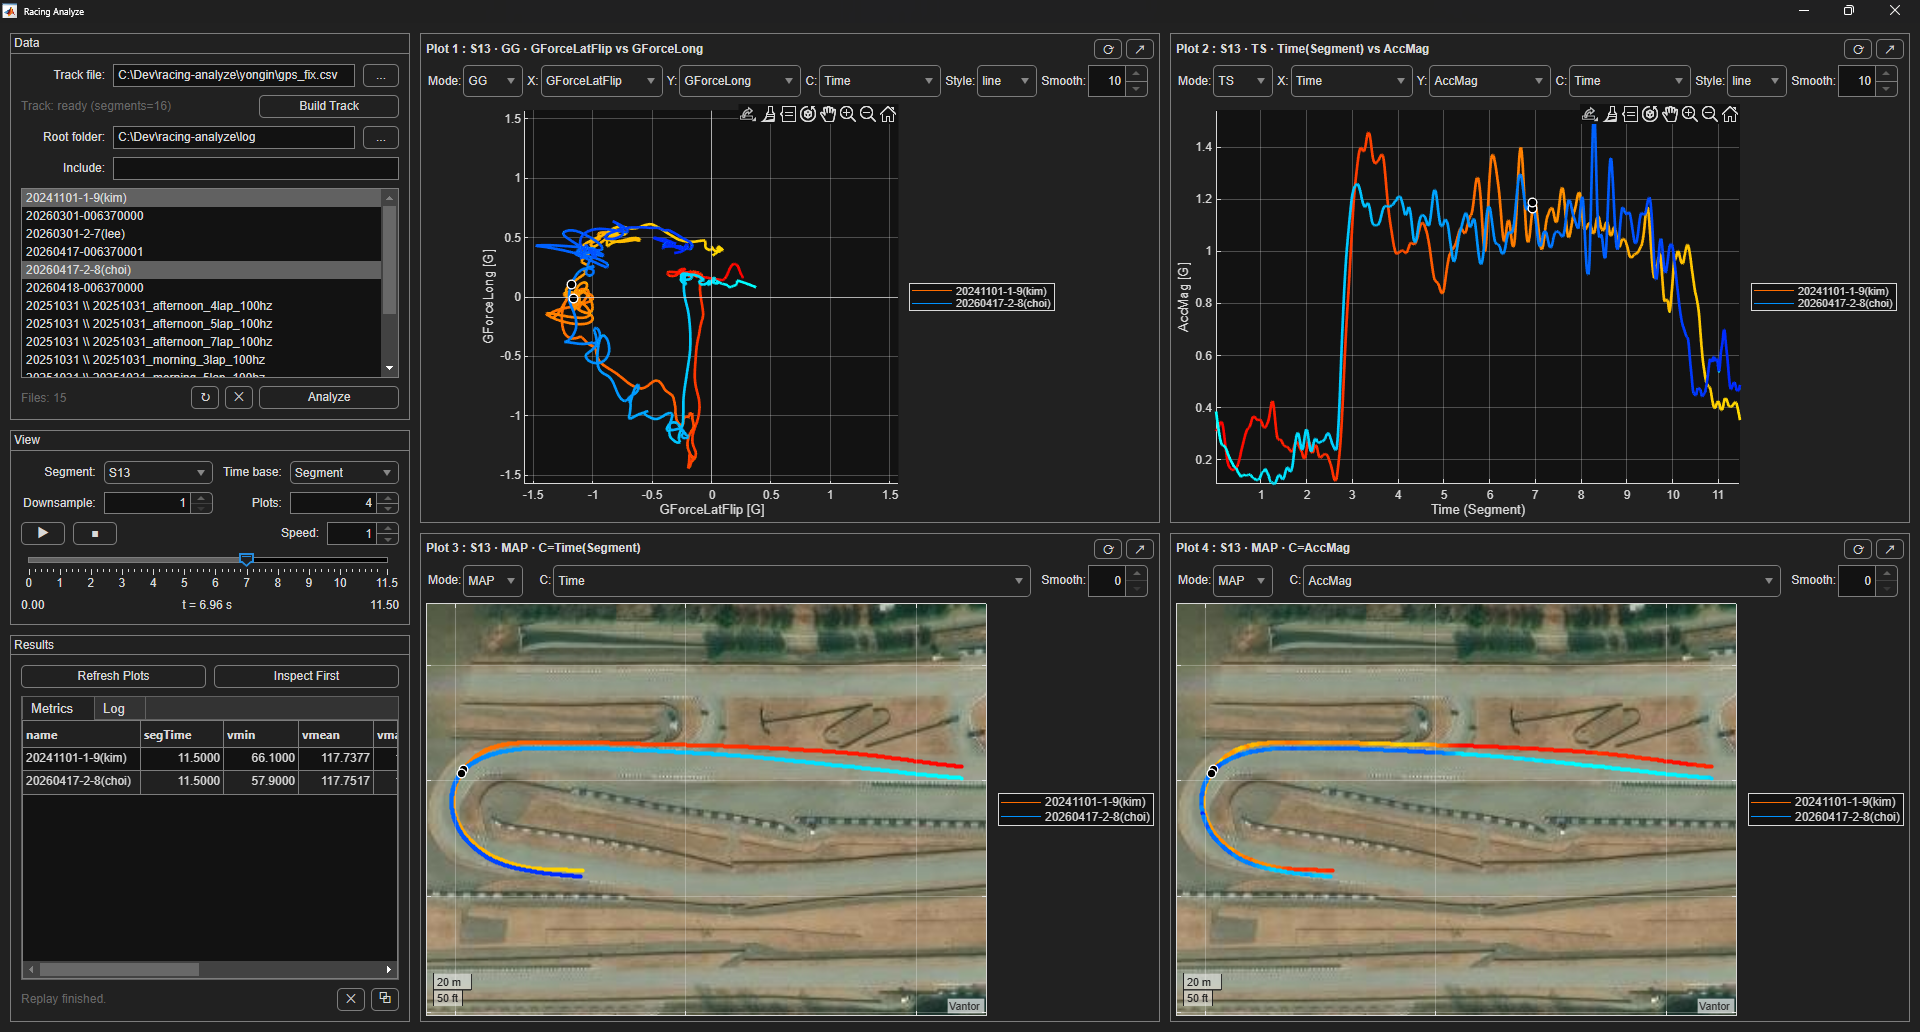
Racing Analyze GUI is a segment-based telemetry workbench for loading multiple runs, comparing the same track region across runs, replaying them in time, and extracting metrics for coaching-oriented review.
Workflow
Track Buildreference core + segment definition from a track file
→
Log Loadscan root folders, filter includes, cache selected runs
→
Segment SliceAll, S0, S1..Sn, S(n+1)
→
Replay + PlotsXY, TS, MAP, POLAR, KDE, GG with synchronized replay
→
Metricssegment time, speed stats, acceleration indicators
What I Built
- Track-core and segment workflow so repeated runs can be compared against the same reference structure.
- Multi-log loading and caching for quick switching after one analysis pass.
- Synchronized replay system with time slider, play/pause/stop, speed control, and pane-aware markers.
- Flexible pane system with XY, TS, MAP, POLAR, KDE, and GG views plus per-pane rerender/pop-out tools.
- Channel-flexible visualization where arbitrary logged channels can be assigned to axes or color.
- Metrics extraction for segment time, speed statistics, and acceleration-related indicators.
Metrics Exposed In The App
- segTime: selected-segment time
- vmin / vmean / vmax: speed min / mean / max
- vin / vout: speed at segment entry / exit
- arms / a95 / amax: acceleration magnitude statistics for quick comparison
Result
- Built a reusable telemetry inspection workflow around track segments, replay, and multi-run comparison.
- Implemented pane state, replay control, flexible channel mapping, and segment metrics as UI features.
- Connected the analysis workflow to the same racing telemetry data collection path.
Evidence
- The GUI is structured as a workbench: track build, run caching, segment slicing, replay, plots, and metrics are separate steps in one flow.
- The app supports multiple analysis views and pane-level tools, which is stronger evidence of repeated real use than a single static screenshot.
- The telemetry workflow is connected upstream to the Racing Telemetry Stack, so this page describes the analysis side of the same system.
Validation Scope
- This page focuses on implemented UI behavior, replay workflow, and exposed segment metrics.
- The strongest evidence is the reusable analysis workflow: track build, multi-run loading, synchronized replay, flexible plots, and metrics extraction.